Making Environmental Public Health Data Accessible

Tracking connects what is known about where environmental hazards exist, where people are getting sick, and how targeted action can reduce illness and save lives. 

The Vermont Tracking Program aims to make environmental public health data accessible to people living in Vermont so they can make informed decisions about their health and environmental exposures. 

Additionally, the program aims to raise awareness of factors that lead to health disparities – such as systems of oppression or historical marginalization based on race, class or gender – with the goals of: 

Image
A blue circle with the number 1 inside.

Identifying health disparities by analyzing data in a timely fashion and at spatial scales that are relevant to communities in order to support decisions about public and private investments in health care access, housing, education, transportation, energy infrastructure, disaster preparedness, resilience, and a clean environment.

Image
A blue circle with the number 2 inside.

Elevating environmental justice by using data to highlight groups and places disproportionately affected by environmental burdens and use an environmental justice framework to reduce environmental exposures and disease.

Image
A blue circle with the number  inside.

Being responsive by having the feedback mechanisms in place to allow Vermont Tracking to align data development, focus areas, and public health actions with community priorities and needs. 

Image
A blue circle with the number 4 inside.

Promoting action by bringing together environmental and health resources that are accessible and easy to use to help people and organizations better understand potential hazards in their communities and what actions can be taken to address them. 

Vermont Tracking in Action

Read these stories to learn about how Vermont Tracking is improving environmental public health in Vermont.

Image
An exclamation point with the word New under it.
Identifying rural communities at higher risk for exposure to radon

Radon is the leading cause of lung cancer among people who don’t smoke

Radon is a naturally occurring radioactive gas with no color, smell, or taste. While radon is the leading cause of cancer among people who don’t smoke, for people who smoke the risk of lung cancer is even greater. One in seven Vermont homes has elevated levels of radon, and the only way to know what the level of radon is in a home is to have the indoor air tested. If radon levels are elevated, there are affordable ways to mitigate, or fix, the radon problem.

Community-based email outreach is not equally effective in all Vermont counties

Since 2016, the Radon Program has been using a community-based email service, called Front Porch Forum, to offer free test kits during Radon Action Month in January. Knowing that radon testing rates were low in certain parts of the state, the Tracking Program analyzed radon data in 2021 to look at the effectiveness of using Front Porch Forum as the primary method of outreach. 

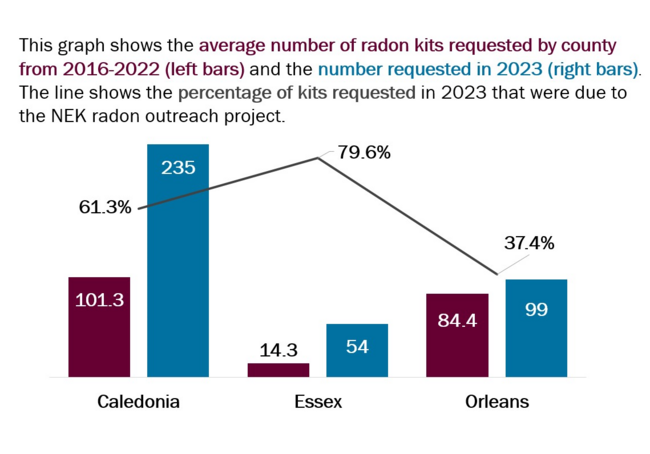
The analysis revealed that requests for radon test kits were not equally distributed across the state. In Caledonia, Essex and Orleans counties, also known as the Northeast Kingdom (NEK), there were proportionally fewer requests for radon test kits than in other parts of the state. Additionally, there were fewer Front Porch Forum user accounts per capita in the NEK – a region of Vermont with limited high-speed internet access – meaning that the primary outreach method was underserving this area of the state. This is especially concerning since we know the bedrock geology in the NEK is associated with higher radon levels. 

Vermont Tracking collaborates with the Radon Program and local health offices on directed outreach

In late 2022, the Tracking Program partnered with the Radon Program to improve radon testing rates in the NEK. Using an in-person community engagement approach, the programs worked with colleagues in the Offices of Local Health in St. Johnsbury and Newport to reach community partners in town offices, libraries and health centers (among others). Partners were given three choices for how to interact with their community:

  1. Distributing radon test kits directly to individuals.
  2. Distributing coupons that could be returned to the Radon Program for a radon test kit.
  3. Receiving an education package intended to improve their community’s understanding of radon risk in the NEK. 

The project was launched during Radon Action Month in January of 2023.

Preliminary results demonstrate the project’s success

In late summer 2023, the Tracking Program analyzed data from the project and found that initial results showed the outreach was successful at improving the rate of test kit requests in the NEK. In subsequent years, the results from these kits will be analyzed, used to inform decisions about radon mitigation projects, and added to the Radon Risk Maps to inform future outreach work. 

Image
graph
Protecting Vermonters from cyanobacteria blooms

Cyanobacteria affect Vermont lakes

Cyanobacteria, also known as blue-green algae, are a natural component of marine and freshwater ecosystems. Under certain conditions, cyanobacteria multiply quickly, creating blooms. Some blooms produce toxins that can make people and pets sick. Vermonters are encouraged to know what cyanobacteria blooms look like so they can stay away from them.

Vermont Tracking develops innovative monitoring system

The Vermont Tracking Program developed a monitoring system to provide timely information on cyanobacteria conditions. Lake Champlain and a dozen inland lakes are regularly monitored by trained volunteers from a local conservation organization and by staff from the departments of Environmental Conservation and Health. Following approval by a site moderator, reports are posted on the Cyanobacteria Tracker map. The reports are assigned to one of three alert categories based on the conditions observed.

Before the web-based monitoring system was put into place, it took staff up to a week to publish the data. Cyanobacteria blooms can appear or disappear very quickly, making week-old data of little use. Now the public can see cyanobacteria conditions at more than 140 different locations shortly after the volunteers submit their reports.

Crowd-sourced data help protect residents and raise awareness

Vermonters can also help crowd source the reporting of conditions. Using an online form, people can easily send in reports, upload photos, and relay the location of cyanobacteria blooms. Staff from the departments of Environmental Conservation and Health or the Lake Champlain Committee review each report for whether it is a cyanobacteria bloom. If it is, the report will be posted on the Cyanobacteria Tracker map. The map is interactive, which allows users to click on a report location to see details and any photos that have been uploaded. 

People who check the Cyanobacteria Tracker map can also learn how to identify blooms and what steps to take to protect themselves, their families, and their pets from exposure. According to David Grass, PhD, who directs Vermont’s Tracking Program, “the Cyanobacteria Tracker has two goals: to provide timely information for Vermonters headed to a lake or beach, and to teach people how to identify cyanobacteria conditions on their own.”

Helping Vermonters with allergies and asthma understand pollen seasonality

Pollen affects people with allergies and asthma

Pollen can cause health concerns, particularly for people with allergies, asthma and other respiratory conditions. Vermont has the fifth highest prevalence of asthma in the U.S., affecting 12% of adults and 7% of children. Most people with asthma also suffer from allergies. Pollen can trigger an allergy-related asthma attack. People with asthma need to be especially aware of what types of pollen affect them, where the pollen is coming from, and the timing of pollen seasons.

Vermont Tracking partners with local allergy and asthma clinic to provide data

There are no National Allergy Bureau monitoring stations in New England north of Connecticut. However, to meet the need for local data, the clinical staff from an allergy and asthma practice in Williston, Vermont have been collecting pollen count data at a monitoring station since 2009. In 2019, the Vermont Tracking Program partnered with the clinic to provide a platform to display the pollen data. The Pollen Tracker shows how pollen counts change over the course of a year (or many years) for tree, grass and weed pollen. 

Seasonality of pollen is visualized through the Pollen Tracker

Compiling pollen data from 2009 has allowed people with allergies and asthma to see trends of tree, grass and weed pollen and to learn more about the timing of pollen season so they can better manage their symptoms. Tree pollen season tends to begin in late March or early April and peaks in May. Grass pollen season tends to begin in mid-May and peak in June. There is a small increase in weed pollen in late May and early June, while the season peaks in late August. The Pollen Tracker can also be used to observe whether there are changes in timing or extent of the pollen season as a result of climate change. 

Incorporating health equity into emergency planning

Identifying populations that may need more help

Some communities in Vermont have social and economic characteristics that can influence their ability to respond to environmental and public health hazards. Understanding community-level vulnerabilities can help community planners and organizations prepare for emergencies, like floods and heat waves. Vulnerability indicators attempt to shed light on the underlying factors that influence why some communities are more affected by a particular hazard, such as a natural disaster. Vulnerability indicators can serve as planning tools to focus health impact prevention efforts in areas of greatest risk. Vulnerability indicators can also be used when there is a disease outbreak or an emergency to identify populations that may need more help with response and recovery.

Vermont Tracking develops a planning tool for communities

The Vermont Tracking Program created the Vermont Social Vulnerability Index (SVI) to evaluate the relative social vulnerability across the state. Social vulnerability refers to the resilience of communities when responding to or recovering from threats to public health. The SVI is a planning tool that community planners and organizations can use to identify populations that may need more help routinely or in the event of an environmental or public health emergency. It draws together 16 different measures of vulnerability in three different themes: socioeconomic, demographic, and housing/transportation. The Vermont Tracking Program also produced a video that shows community planners and organizations how to use the Vermont Social Vulnerability Index to best fit their community’s needs. 

From data to action: applying the Social Vulnerability Index to the real world

Various groups across Vermont have used the sub-county information in the SVI to address economic, health and social inequities. During the COVID-19 pandemic, the SVI was used to assist with the location of testing centers and vaccination clinics as well as safe quarantine and isolation sites. Collaborators of the Vermont Environmental Justice Project used the SVI to identify and map environmental disparities. Students have also used the SVI for research projects

Protecting Vermont children from lead in drinking water

Lead in drinking water at schools and child care facilities adds to a child’s lead burden

Children can come in contact with lead in many ways. Lead exposure poses a special risk to young children because they absorb lead into their systems more easily than adults do. Lead can slow down growth, impair development and learning, and can cause behavior problems.

While a major source of lead exposure in Vermont children is paint, lead in older plumbing and fixtures can add to a child’s overall lead exposure. Many Vermont schools and child care facilities are in older buildings, which means they are more likely to have lead in the plumbing. Plus, water that sits in lead plumbing and fixtures when it's not being used likely contains higher levels of lead.

Vermont Tracking helps uncover the need for statewide testing

In November 2017, the Vermont Tracking Program, in partnership with the Vermont Agency of Education and Department of Environmental Conservation conducted a pilot program to test drinking water for lead at 16 public schools. Lead was detected (above 1 ppb (parts per billion)) in the drinking water of at least three taps in all schools, and elevated lead levels (at or above 15 ppb) were found at one or more taps in five schools. Schools removed taps with elevated lead levels from service and worked with the State to find the best possible solutions to lower lead levels, which primarily involved removing or replacing older plumbing fixtures. 

Building on the pilot, a new State law (Act 66) was passed in 2019 that requires all Vermont schools and child care providers to test water samples from all of the fixtures used for drinking or cooking for lead. If lead levels are found at or above the action level of 4 parts per billion (ppb), the school or child care provider must immediately take the fixture out of service and take corrective action to eliminate or reduce the amount of lead to below the action level. 

Schools and child care programs have safer drinking water

Lead results for every school and child care facility are publicly available on the results website. In all, 98% (416 out of 424) of schools and 98% (751 out of 770) of non-school based child care facilities successfully completed testing. Twenty percent of the taps had initial results at or above the action level. Three-quarters of the schools (76%) and 14% of non-school based child care facilities had at least one tap with lead levels at or above the action level. Bottle fillers consistently had the lowest lead levels compared to other fixture types. Sinks were the most common tap tested and had among the highest lead levels. Six sinks had results greater than 1,000 ppb, one exceeded 25,000 ppb. 

Successful remediation was possible without incurring large expenses. The most common remediation actions were fixture replacement (54%), removal from service (17%), and point-of-use filter installation (9%). Remediation costs were less than $500 per tap 90% of the time. Moving forward, schools and child care will have to retest every three years. If lead is not detected at a tap after three rounds of testing, it can be exempted from future testing requirements. 

When presenting the results of the first round of testing to the Vermont State Senate Committee on Education, Health Commissioner Mark Levine, MD concluded that “we stopped thousands of kids from ingesting lead at hundreds of schools and many child cares throughout the state.”

Using crowd-sourced data to track ticks

More tick data needed in Vermont

Fifteen different tick species have been identified in Vermont, but only five are known to carry pathogens that cause disease in humans, such as Lyme disease. Climate change and other ecological changes may affect the distribution and abundance of these ticks. Being able to track where ticks are is one way to monitor how their range may be changing. Vermont’s tick surveillance activities involve sampling only a few locations a few times per year. As a result, data about the locations and timing of high tick activity are limited. This makes it difficult for public health workers to identify areas where people might be at higher risk for Lyme disease or other tickborne diseases.

Vermont Tracking uses crowd-sourced data to engage the public in tick surveillance

To help improve tick monitoring, the Vermont Tracking Program, in partnership with CDC’s Climate and Health Program, developed a “crowd-sourced” web application called the Tick Tracker. The Tick Tracker is a helpful tool that allows the public to contribute to the understanding of ticks in Vermont. In as little as a minute, anyone can report tick sightings to the Vermont Department of Health via an online map. The Tick Tracker gives members of the community an opportunity to get involved by identifying tick hot spots and sharing this information with others to help them make informed decisions about protecting themselves from tick bites.

Tick Tracker serves as an educational tool for residents

Ticks have become quite abundant in many parts of Vermont. The Tick Tracker allows Vermonters to better understand and share how these changes may be occurring. The Tick Tracker shows where people may need to take extra care to prevent tick bites when spending time outdoors. On the map, users can also view a data layer that shows tickborne disease cases per 100,000 people for Lyme disease, anaplasmosis and babesiosis. Along with the map, there are links to information about tick-borne diseases and preventing tick bites to keep Vermonters better informed.